Skip to content 3.2. OTHER MAP ADJUSTMENT
3.2. OTHER MAP ADJUSTMENT
Having followed the proper process of fuel maps optimisation, the next step is to set the second important part of the fuel maps – the AFR map, i.e. the map of the target AFR values which is now the guiding principle for the EFI system to calculate fuel injection and therefore the actual AFR of the engine.
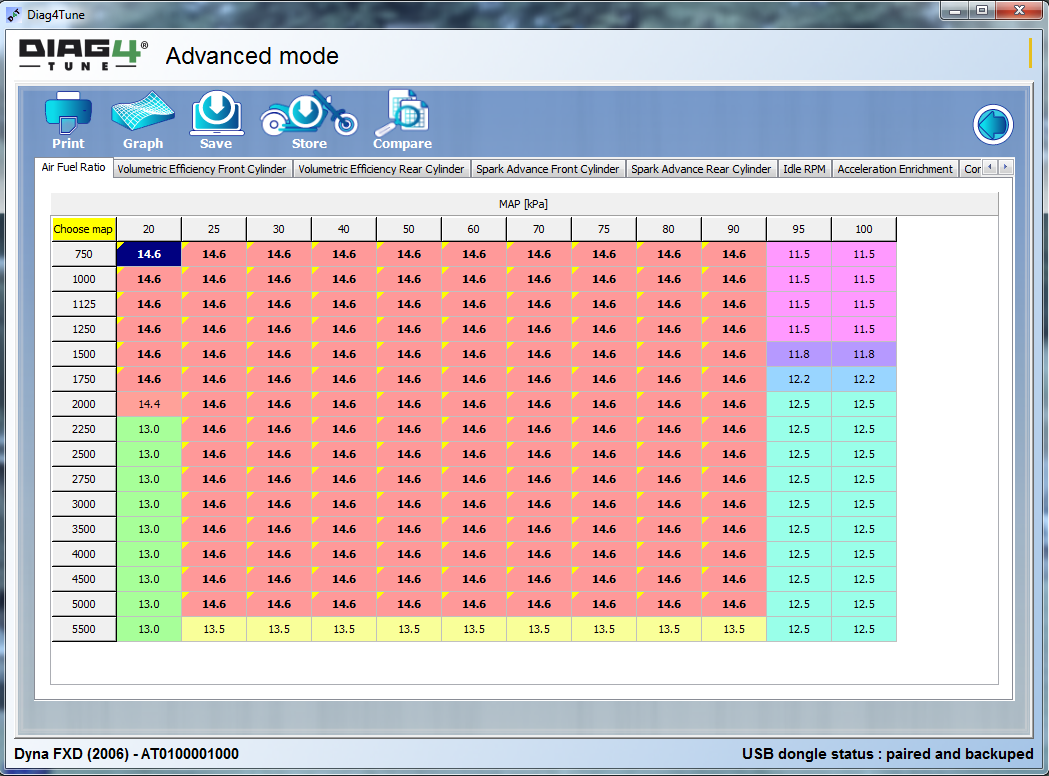 An example of a typical AFR map map is shown on the left . The values of 14.6 are the engine modes where the EFI system sets stoichiometric ratio of the combustion controlled by built-in lambda sensors.
Lower AFR (richer mixture) is set only for extreme modes (high RPM and full throttle, MAP close to 100 kPa). In this case the main reason for using a rich mixture is better cooling of the engine in extreme modes and partly also increased power (as shown below). A relatively rich mixture is also set for closed throttle throughout the entire RPM range (MAP around 20 kPa). In this case, the reason is to suppress back-fire during deceleration. EFI maintains the mixing ratio well above the ignition limit so that the mixture burns out reliably and to prevent its accumulation in the exhaust. If it accumulated in the exhaust, there would necessarily be some random ignition of the mixture in the cylinder which would in turn ignite the unburned mixture in the exhaust with a strong acoustic manifestation.
The marginal modes described in the previous paragraph are not interesting in terms of tuning (unless our goal is to annoy a neighbour or their dog by occasional back-fire to the exhaust). Our region of interest should be the area where the target AFR is set to 14.6, i.e. we should focus on controlling the mixing ratio by closed loop of lambda sensors. This is undoubtedly the best way of control, in terms of engine emissions and more or less in terms of fuel consumption. However, it is obviously not optimal with regard to the achievable torque and engine power, which is illustrated by the following characteristics.
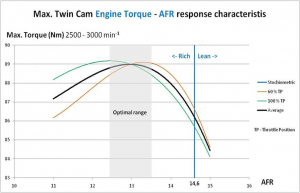
The pattern of maximum torque of the V-Twin engine, depending on the set AFR
These characteristics show the maximum torque curve of the V-Twin engine (which was always found in the speed range from 2500 to 3000 min-1) depending on the set AFR. The green curve represents the measurement at 100% throttle opening. The orange curve represents the maximum torque pattern in continuous throttle opening to 60%. The black curve shows the average value. The results of the measurement show that torque characteristics can be increased merely by appropriate setting of AFR.